Vacancy Rate Calculator
Work out physical and economic vacancy from units, move-outs, empty days, concessions and unpaid rent.
Free · runs in your browser · nothing is uploaded
How to use the vacancy rate calculator
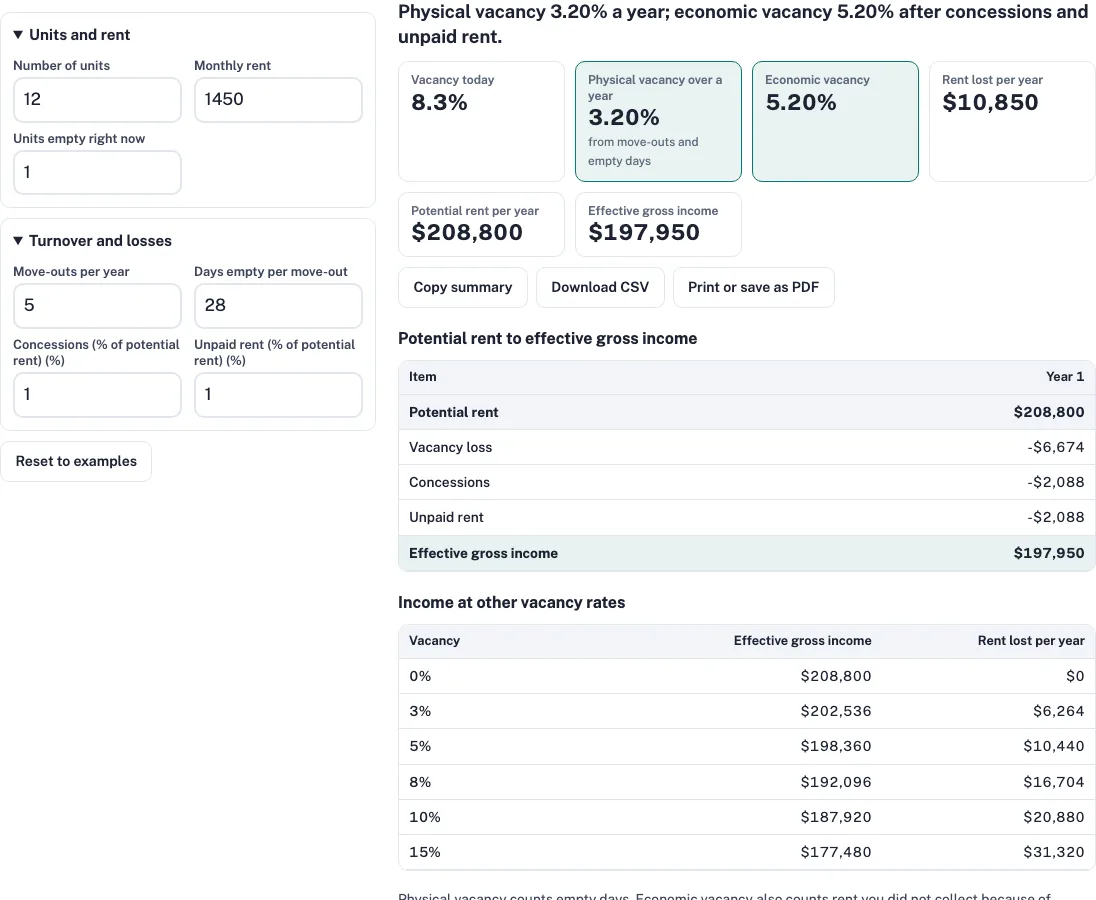
- Enter the Number of units in the building. The example is 12.
- Enter the Monthly rent for one unit. The example is $1,450.
- Enter the Units empty right now to get today’s snapshot. The example is 1.
- Enter the Move-outs per year in the past year. The example is 5.
- Enter the Days empty per move-out, counting from move-out to the next paid rent. The example is 28.
- Enter Concessions (% of potential rent), such as free weeks or discounts. The example is 1.
- Enter Unpaid rent (% of potential rent) for rent you did not collect. The example is 1.
- Read Vacancy today and Physical vacancy over a year to see the time-based measures.
- Read Economic vacancy, Rent lost per year and Effective gross income.
- Check the table Income at other vacancy rates to see how income moves from 0% to 15%.
The results update as you type. The buttons Reset to examples, Copy summary, Download CSV and Print or save as PDF restore the example inputs, copy the summary, save the figures as a CSV file and make a printable page. The page address holds your inputs, so a link to it recreates the same result.
Change one input at a time to see which result moves. The address bar keeps your inputs, so you can bookmark or share a scenario. Reset to examples restores the example values.
How do you calculate the vacancy rate?
The snapshot vacancy rate is empty units divided by total units. With one empty unit out of 12, that is 1 / 12 = 8.3%, the Vacancy today figure. It shows one day only, so it can mislead about a whole year.
Physical vacancy over a year is move-outs times empty days, divided by units times 365. In the example, (5 × 28) / (12 × 365) = 140 / 4,380 = 3.20%.
Physical vacancy versus economic vacancy
Physical vacancy measures time. It counts empty days, and nothing else. Economic vacancy measures money. Its formula is vacancy loss, plus concessions, plus unpaid rent, divided by potential rent. Potential rent is the full rent if every unit were paid every month: $1,450 × 12 × 12 = $208,800 a year.
In the example, the vacancy loss is 3.20% of $208,800, which is $6,674. Concessions and unpaid rent are each 1%, or $2,088. Together they come to $10,850, and $10,850 / $208,800 = 5.20%, the Economic vacancy. The table below shows the same figures in dollars.
| Item | Year 1 |
|---|---|
| Potential rent | $208,800 |
| Vacancy loss | -$6,674 |
| Concessions | -$2,088 |
| Unpaid rent | -$2,088 |
| Effective gross income | $197,950 |
Effective gross income is potential rent minus all three losses: $208,800 - $10,850 = $197,950.
How do you read the vacancy result?
Read the snapshot first, then the year. The Vacancy today figure of 8.3% reflects one empty unit on the day you enter it. The yearly figures of 3.20% and 5.20% reflect how many units left and how long they stayed empty. If the snapshot and the yearly figure differ a lot, check whether the empty unit is a long-term problem or a recent move-out. Use the yearly figure for income planning, because one day rarely shows the typical year.
Is a 5% vacancy rate good?
It depends on the market and the property. This calculator does not rate a number as good or bad. The example economic vacancy is 5.20%, which is close to 5%, but whether that suits your building is a question for your own records. Compare it with the move-outs, empty days, concessions and unpaid rent you actually had over a full year.
How does vacancy change your income?
Each point of vacancy on $208,800 of potential rent costs $2,088 a year. The table shows the effect at several rates.
| Vacancy | Effective gross income | Rent lost per year |
|---|---|---|
| 0% | $208,800 | $0 |
| 3% | $202,536 | $6,264 |
| 5% | $198,360 | $10,440 |
| 8% | $192,096 | $16,704 |
| 10% | $187,920 | $20,880 |
| 15% | $177,480 | $31,320 |
Which vacancy figure should you enter in other calculators?
Pick the vacancy measure that matches the input label in the calculator you use, and use the same period for every input. Vacancy changes the result in both the cap rate calculator, which shows the effect on return, and the NOI calculator, which puts vacancy into a full operating statement. Test a higher rate as well as your own figure, so you can see how much the result depends on it. Write down which period and which measure you used, so later results stay comparable.
Frequently asked questions
How do you calculate the vacancy rate?
Divide empty units by total units for a snapshot. For a full year, divide move-outs times empty days by units times 365. The example gives 8.3% today and 3.20% physical vacancy over the year.
What is economic vacancy?
Economic vacancy adds concessions and unpaid rent to the empty-day loss, then divides the total by potential rent. In the example it is 5.20%, which is $10,850 of rent lost a year. It is the better measure when you want to know how much of your rent you actually collect.
Is a 5% vacancy rate good?
It depends on the market and the property. Compare the figure with your own move-out and rent records for the past year before you decide what it means for you. A figure from another building or another city tells you little about yours.
What is the 2% rule for rentals?
It is a rent-to-price screen, not a vacancy measure. It asks whether monthly rent is at least 2% of the price. It uses rent and price only, so vacancy does not change it. For the 1% version, see the 1% rule calculator.
Why do the two vacancy measures differ?
Physical vacancy counts only empty days, so it leaves out rent you did not collect. Economic vacancy adds concessions and unpaid rent, so it is usually the larger of the two in the example.
Why is vacancy rate important for real estate investors?
Vacancy cuts income directly, and it also changes the cap rate and net operating income. On the example’s $208,800 of potential rent, each point of vacancy costs $2,088 a year. The table in this calculator shows effective gross income from 0% to 15%, so you can test a rate higher than your own.
What is the difference between vacancy rate and occupancy rate?
The vacancy rate is the share of units or days that are empty, and the occupancy rate is the share that are filled. The two add up to 100%, so occupancy equals 100% minus the vacancy rate. The example’s 3.20% physical vacancy over the year equals 96.80% occupancy.
How do I reduce vacancy?
This calculator cannot say which steps will fill units. It shows what each point of vacancy costs, so you can judge how much a change is worth: at the example rent, one point is $2,088 a year. Run the figures again with your own vacancy after any change to see the effect.
Related tools
- cap rate calculator: use it to see how vacancy changes the cap rate.
- NOI calculator: use it to put vacancy into a full net operating income statement.
- rental income calculator: use it for monthly cash flow from rent.
- rental property calculator: use it for a multi-year projection.
- 1 percent rule calculator: use it for a quick rent-to-price screen.
- DSCR calculator: use it to see whether income still covers the loan after vacancy.