Short Term Rental Calculator
Turn nightly rate and occupancy into net income and cash flow, and compare it with renting the same place long term.
Free · runs in your browser · nothing is uploaded
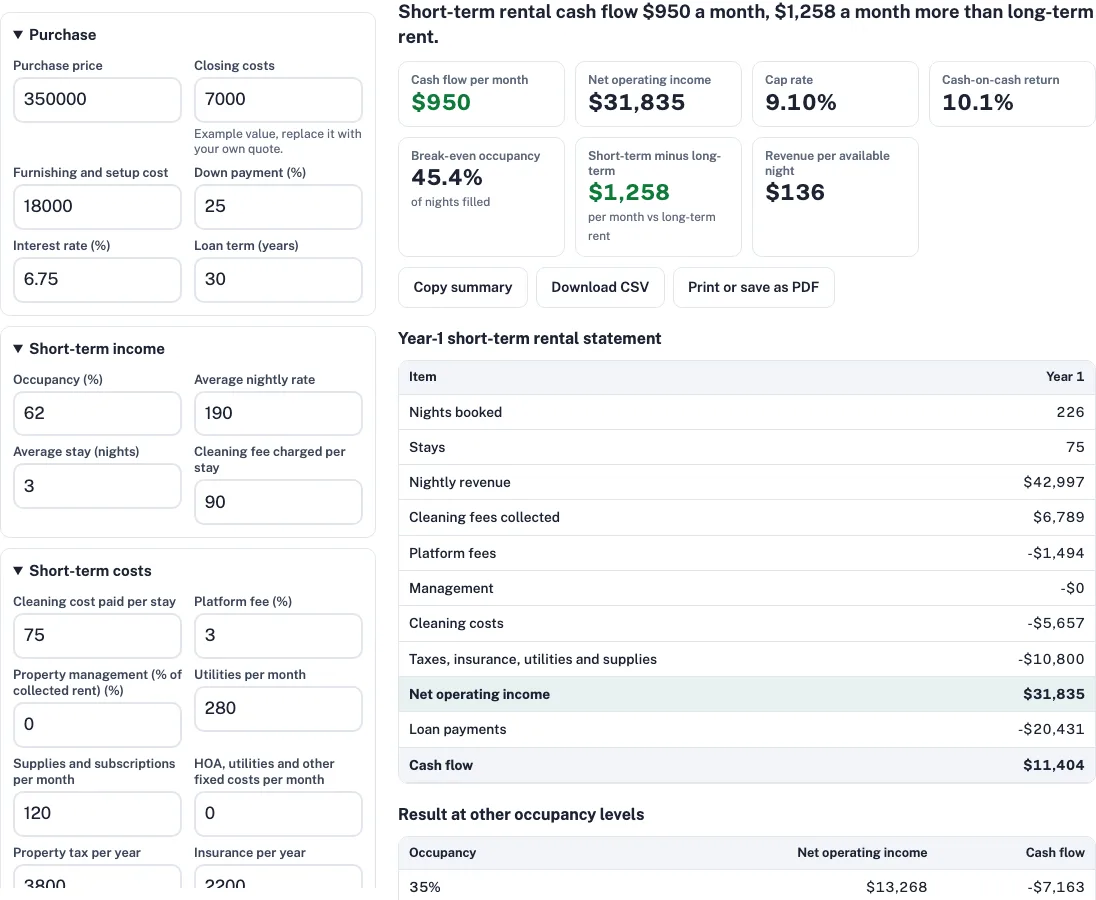
How to use the short term rental calculator
- Enter the Purchase price, then the one-off costs: Closing costs and Furnishing and setup cost.
- Set the loan with Down payment, Interest rate and Loan term (years).
- Enter the booking pattern: Occupancy (the share of nights booked), Average nightly rate and Average stay (nights).
- Enter the cleaning money for each stay: Cleaning fee charged per stay and Cleaning cost paid per stay.
- Enter the Platform fee and Property management (% of collected rent).
- Enter the running costs: Utilities per month, Supplies and subscriptions per month and HOA, utilities and other fixed costs per month.
- Enter the yearly bills: Property tax per year and Insurance per year.
- Enter the long-term comparison: Long-term rent per month, Long-term vacancy, Long-term management fee and Long-term maintenance (% of rent).
- Read the cash flow and the break-even occupancy, then change one input at a time, such as Occupancy, to see how much room you have.
- Check the local rules for permits, night caps and taxes before you rely on the result.
The results update live as you type. Reset to examples restores the sample inputs, Copy summary copies the figures as text, Download CSV saves the results to a file, and Print or save as PDF prints the page. The page address holds your inputs, so a link you share recreates the same result. The example values are defaults for illustration, not market data.
How does the short term rental calculator work?
The calculator estimates one year of nightly renting. It multiplies nights booked by your average nightly rate and adds the cleaning fees you collect. It then subtracts the cost of running the rental and the loan payments. What remains is cash flow.
Nights booked are the year’s 365 nights multiplied by occupancy. At 62% occupancy the tool works with 226.3 nights, shown as 226 in the table. Nightly revenue is 226.3 × $190 = $42,997. Stays are 226.3 ÷ 3 ≈ 75.4, so cleaning fees collected are 75.4 × $90 = $6,789.
The Year-1 statement for the example:
| Item | Year 1 |
|---|---|
| Nights booked | 226 |
| Stays | 75 |
| Nightly revenue | $42,997 |
| Cleaning fees collected | $6,789 |
| Platform fees | -$1,494 |
| Management | -$0 |
| Cleaning costs | -$5,657 |
| Taxes, insurance, utilities and supplies | -$10,800 |
| Net operating income | $31,835 |
| Loan payments | -$20,431 |
| Cash flow | $11,404 |
Each cost line follows from your inputs. Platform fees are 3% of collected revenue: 3% × $49,786 = $1,494, where $49,786 is $42,997 plus $6,789. Cleaning costs are 75.4 × $75 = $5,657. The $10,800 line is $3,800 property tax, $2,200 insurance, $3,360 utilities ($280 × 12) and $1,440 supplies ($120 × 12). Net operating income is $49,786 − $1,494 − $5,657 − $10,800 = $31,835. After $20,431 of loan payments, cash flow is $11,404, or about $950 a month.
How much can you make with a short term rental?
At the example inputs, Year 1 net operating income is $31,835 and cash flow is $11,404. The result depends on the nightly rate and occupancy you enter, and on every cost you add. The table shows how the result moves with occupancy alone.
| Occupancy | Net operating income | Cash flow |
|---|---|---|
| 35% | $13,268 | -$7,163 |
| 45% | $20,145 | -$286 |
| 55% | $27,021 | $6,590 |
| 65% | $33,898 | $13,467 |
| 75% | $40,775 | $20,344 |
| 85% | $47,651 | $27,220 |
Between 45% and 55%, cash flow rises by $6,876 ($6,590 + $286), so each point of occupancy adds about $688 a year. Each extra booked night brings in the nightly rate and cleaning fee, less the cleaning and platform costs on it. The loan payment and fixed costs do not change with occupancy.
What occupancy do I need to break even on a short-term rental?
The break-even occupancy is 45.4%. At that share of nights filled, operating income covers the loan payments and cash flow is zero. At 45% the example loses $286 a year, and at 55% it makes $6,590. Using the $688 per point from the table, the zero point sits at 45 + 286 ÷ 688 ≈ 45.4%.
Break-even occupancy is a planning figure, not a forecast. The tool does not model seasonality, so a busy summer and a quiet winter are averaged into one occupancy number. To test a quieter year, lower Occupancy and watch the break-even line.
What is revenue per available night?
Revenue per available night is $136 in the example. It is total collected revenue divided by every night of the year, booked or empty: ($42,997 + $6,789) ÷ 365 = $136. Empty nights count in the divisor, so the figure combines occupancy and nightly rate in one number.
Short-term versus long-term rent on the same property
On the same property, the example shows cash flow of $950 a month from short-term renting. That is $1,258 a month more than long-term rent. The long-term side uses your Long-term rent per month, Long-term vacancy, Long-term management fee and Long-term maintenance (% of rent). Those inputs decide the gap, so replace the example values with figures from your own area.
| Key result | Example value |
|---|---|
| Net operating income | $31,835 |
| Cap rate | 9.10% |
| Cash-on-cash return | 10.1% |
| Break-even occupancy | 45.4% |
| Revenue per available night | $136 |
Furnishing and setup cost is cash invested, not a yearly cost. It is left out of net operating income but included in the cash-on-cash return. In the example, cash invested is $112,500: a 25% down payment of $87,500, plus $7,000 closing costs and $18,000 furnishing. Cash flow of $11,404 divided by $112,500 gives 10.1%.
Which costs does the calculator include, and which does it leave out?
The calculator includes platform fees, property management, cleaning costs, utilities, supplies and subscriptions, property tax, insurance, HOA and other fixed costs, and the loan payment. It does not model seasonality. It does not know local permits, night caps or taxes, which differ by city and can change. Check them with your city before you rely on a result.
Frequently asked questions
How much can you make with a short term rental?
At the example inputs the tool shows $31,835 of net operating income and $11,404 of cash flow for the year. Your own figure depends on the nightly rate and occupancy you enter, not on market data.
What occupancy do I need to break even on a short-term rental?
At the example inputs, 45.4% of nights must be filled for cash flow to reach zero. Each extra point of occupancy adds about $688 a year in this example.
Does the calculator include local permits and taxes?
No. Permits, night caps and taxes differ by city and can change, so check your local rules. The only tax figure in the calculator is the property tax you enter.
Why do the results change so much with occupancy?
Each booked night adds revenue while the loan payment and fixed costs stay the same. At 35% occupancy cash flow is -$7,163 a year, and at 85% it is $27,220 a year.
Does the calculator use real market data for my area?
No. It has no market data. Tools such as AirDNA, BnBCalc and Rabbu estimate revenue from market data, and you can compare their figures with your inputs.
What does the Airbnb calculator show you?
It shows a year-1 statement for one listing: nights booked, nightly and cleaning revenue, platform, management and cleaning costs, taxes, insurance, utilities and supplies, net operating income and cash flow. Key results include the cap rate, cash-on-cash return, break-even occupancy and revenue per available night. Every figure comes from the inputs you type.
How accurate are Airbnb income calculators?
The result is only as accurate as the inputs. This tool uses only the nightly rate, occupancy, stay length and costs you enter, and it has no market data for your area. Check the occupancy and rate against bookings for similar listings, and test a lower occupancy as well.
Related tools
- rental property calculator: use it for a long-term projection of the same property.
- rental income calculator: use it for the long-term monthly cash flow.
- cash on cash return calculator: use it for the return on the cash you put in.
- cap rate calculator: use it for the unlevered return on the property.
- dscr calculator: use it to check lender coverage on a loan.
- rent vs buy calculator: use it if you are deciding whether to buy.