Rental Property Calculator
Enter the deal and get cash flow, cap rate, cash-on-cash return, DSCR and IRR, then a year-by-year projection with the sale.
Free · runs in your browser · nothing is uploaded
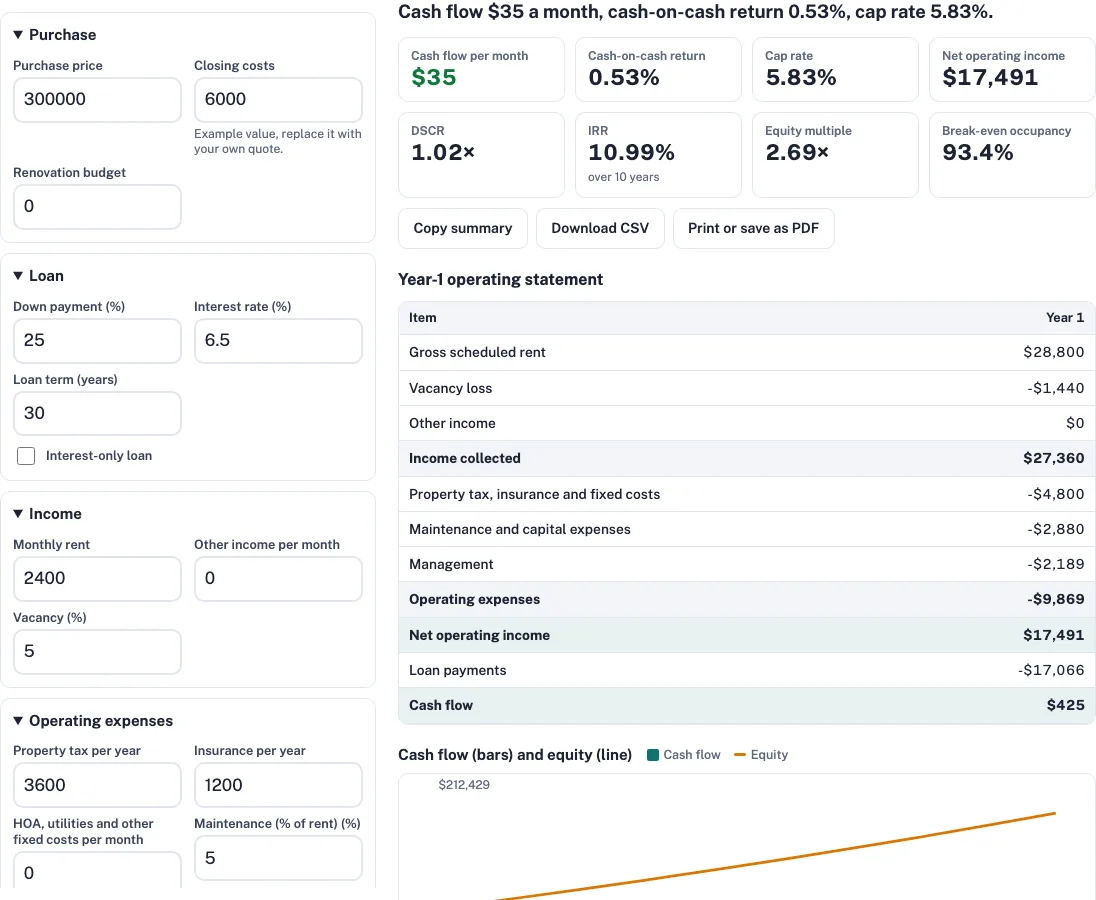
How to use the rental property calculator
- Enter the Purchase price and the Closing costs you expect to pay at purchase.
- Enter a Renovation budget only if you plan work before renting. Otherwise leave it at 0.
- Set the Down payment as a percentage, then enter the Interest rate, Loan term (years) and Interest-only loan from your loan quote.
- Enter Monthly rent and Other income per month, then set Vacancy to the share of rent you expect to lose.
- Enter Property tax per year and Insurance per year, plus HOA, utilities and other fixed costs per month if you pay them.
- Set Maintenance (% of rent), Capital expenses (% of rent) and Property management (% of collected rent).
- Set Rent growth per year, Expense growth per year and Value growth per year for the projection.
- Enter Selling costs and Years you hold it.
- Leave Income tax rate on profit (0 = ignore tax) at 0 unless you want an after-tax figure.
- Read the headline, then the year-by-year projection.
The results update as you type. Reset to examples puts back the default numbers, and Copy summary, Download CSV and Print or save as PDF give you the results in other forms. The page address holds your inputs, so a link you share recreates the same result.
Change one input at a time to see which result moves. The address bar keeps your inputs, so you can bookmark or share a scenario. Reset to examples restores the example values.
What does the rental property calculator measure?
Net operating income (NOI) is the rent you collect minus operating costs, before any loan payment. Cash flow is NOI minus loan payments. In the example, NOI is $17,491 and cash flow is $425 a year, or $35 a month.
Year-by-year projection
Rent, expenses and value each grow 3% a year in the example.
| Year | Income collected | Net operating income | Loan payments | Cash flow | Loan balance | Value | Equity |
|---|---|---|---|---|---|---|---|
| 1 | $27,360 | $17,491 | $17,066 | $425 | $222,485 | $309,000 | $86,515 |
| 2 | $28,181 | $18,016 | $17,066 | $950 | $219,802 | $318,270 | $98,468 |
| 3 | $29,026 | $18,556 | $17,066 | $1,491 | $216,939 | $327,818 | $110,879 |
| 4 | $29,897 | $19,113 | $17,066 | $2,047 | $213,884 | $337,653 | $123,769 |
| 5 | $30,794 | $19,686 | $17,066 | $2,621 | $210,625 | $347,782 | $137,158 |
| 6 | $31,718 | $20,277 | $17,066 | $3,211 | $207,147 | $358,216 | $151,069 |
| 7 | $32,669 | $20,885 | $17,066 | $3,820 | $203,437 | $368,962 | $165,526 |
| 8 | $33,649 | $21,512 | $17,066 | $4,446 | $199,478 | $380,031 | $180,554 |
| 9 | $34,659 | $22,157 | $17,066 | $5,091 | $195,253 | $391,432 | $196,179 |
| 10 | $35,699 | $22,822 | $17,066 | $5,756 | $190,746 | $403,175 | $212,429 |
| Sale at the end of year 10 | $188,238 | $403,175 |
Ten years of cash flow ($29,858) plus the sale ($188,238) gives $218,096. Divided by the $81,000 invested, that is the 2.69× equity multiple.
How do I value a rental property?
Value equals NOI divided by cap rate. The example’s $17,491 ÷ 5.83% is about $300,000.
| Target | Highest price |
|---|---|
| Highest price for an 8% cap rate | $218,640 |
| Highest price for an 8% cash-on-cash return | $221,252 |
| Highest price for a DSCR of 1.25 | $245,982 |
How do rent and price changes move the return?
Rows change monthly rent and columns change purchase price. A 10% rise in rent lifts the cash-on-cash return from 0.5% to 3.3%.
| Rent change (rows) / price change (columns) | Purchase price -10% | Purchase price -5% | Purchase price ±0% | Purchase price +5% | Purchase price +10% |
|---|---|---|---|---|---|
| Monthly rent -20% | -3.2% | -4.1% | -5.0% | -5.8% | -6.5% |
| Monthly rent -10% | -0.1% | -1.2% | -2.2% | -3.1% | -4.0% |
| Monthly rent ±0% | 2.9% | 1.7% | 0.5% | -0.5% | -1.4% |
| Monthly rent +10% | 5.9% | 4.5% | 3.3% | 2.1% | 1.1% |
| Monthly rent +20% | 9.0% | 7.4% | 6.0% | 4.8% | 3.6% |
What do the 50%, 2% and 7% rules say?
The 50% rule assumes operating costs take about half of gross rent; the example’s are about 34%. The example is 0.8% a month (2% rule) and 9.6% a year (7% rule). For the monthly screen, see the 1% rule calculator.
How do I read break-even occupancy, DSCR and IRR?
Break-even occupancy is the share of gross rent you need to cover operating costs and loan payments: 93.4% here, against 95% occupancy at 5% vacancy. DSCR is NOI divided by loan payments: $17,491 ÷ $17,066 gives 1.02×. IRR is the annual return including the sale.
What does the calculator leave out?
It ignores income tax unless you enter a tax rate and depreciation. Closing costs are one figure, and refinancing is not modelled.
Frequently asked questions
Frequently asked questions
What is the 50% rule for rental property?
It assumes operating costs take about half of gross rent. The example’s operating costs are about 34% of gross rent, so use it as a first check only.
What is the 2% rule for rental property?
It asks whether monthly rent is 2% of the purchase price. The example’s $2,400 on $300,000 is 0.8%.
What is the 7% rule for rental property?
It asks whether annual rent is 7% of the purchase price. The example’s $28,800 is 9.6%, and the screen ignores loan terms and costs.
How do you calculate the value of a rental property?
Divide net operating income by the cap rate you would accept: value = NOI ÷ cap rate. The example gives $17,491 ÷ 5.83%, about $300,000.
What is a good ROI for a rental property?
This calculator does not set an ROI benchmark, because the right return depends on your risk and on what else your cash could earn. In the example, the cash-on-cash return is 0.5% and the equity multiple over the 10-year hold is 2.69×. Compare those with a lower-risk option you could hold. Then change the price or rent until the numbers meet your own target.
What do the inputs and outputs mean?
The inputs describe the deal: purchase price, closing costs, down payment, loan rate and term, rent, vacancy, yearly costs and the growth rates. The outputs show what the deal earns: NOI, cash flow, cap rate, DSCR, IRR, equity multiple and break-even occupancy, plus the year-by-year projection.
How does a rental property calculator estimate my potential cash flow?
It takes NOI, the rent collected after vacancy and operating costs, and subtracts the loan payments for the year. In the example, $17,491 less $17,066 leaves $425 a year, or $35 a month. The projection works in full years, so the monthly figure is an average, not the timing of each month.
Related tools
- cap rate calculator: use it for the NOI-only view before any loan.
- cash on cash return calculator: use it for the first-year return on the cash you invested.
- DSCR calculator: use it to see the same deal from the lender’s side.
- BRRRR calculator: use it if you plan to renovate, rent and refinance.
- investment property calculator: use it to compare two properties side by side.
- short-term rental calculator: use it if the same home could be rented by the night.
- 1% rule calculator: use it as a first screen before the detail.