Rent vs Buy Calculator
Compare owning with renting and investing the difference, and see the year buying pulls ahead.
Free · runs in your browser · nothing is uploaded
How to use the rent vs buy calculator
- Enter the Purchase price of the home you are considering.
- Set the loan with Down payment and Interest rate, then choose the Loan term (years).
- Enter the buying costs with Buying costs (% of price) and Selling costs.
- Enter the owning costs: Property tax (% of value per year), Home maintenance (% of value per year) and Insurance per year.
- Enter how the home is expected to change in value with Value growth per year.
- Enter the renting side: Monthly rent, Rent growth per year and Renter insurance per year.
- Enter Return on invested cash for the money the renter keeps invested.
- Enter Cost inflation per year and the period with Years to compare.
- Read Buying wins from, then the owner and renter net worth at the end of the period.
- Change one input at a time, such as Value growth per year, to see which assumption moves the answer.
The results update live as you type. Reset to examples restores the sample inputs, Copy summary copies the figures as text, Download CSV saves the results to a file, and Print or save as PDF prints the page. The page address holds your inputs, so a link you share recreates the same result. The example values are defaults for illustration, not market data.
What does the rent vs buy calculator compare?
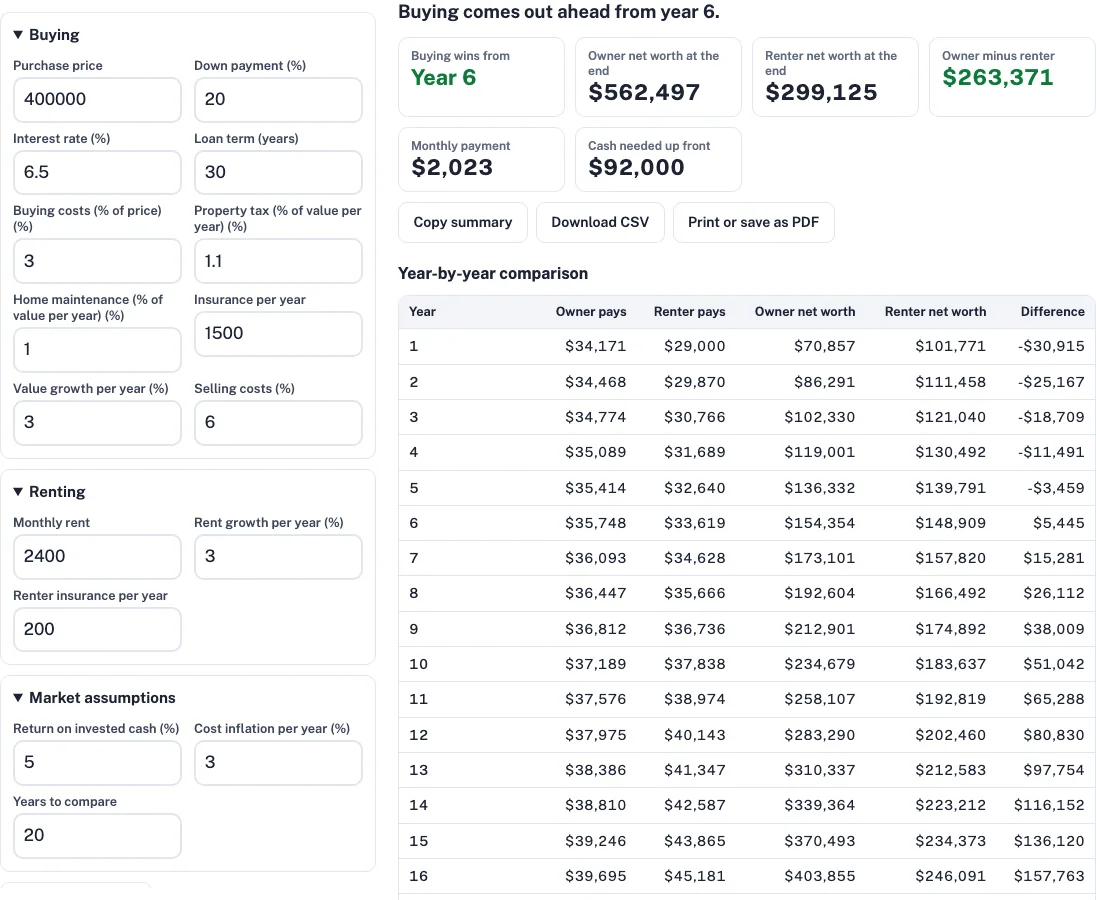
The calculator sets two paths side by side with the same starting cash. The owner buys and pays the loan, property tax, maintenance and insurance. The renter pays rent and renter insurance. Each year, the path that costs less invests the difference. At the end, the calculator deducts sale costs from the home value on the owner’s side, and reports both net worths. In the example, buying comes out ahead from year 6.
The model: who invests the difference
Both paths start with the same cash. In the example the owner needs $92,000 up front: a 20% down payment of $80,000 plus buying costs of 3% of $400,000, which is $12,000. The renter invests that $92,000 at 5%. In year 1 the owner pays $34,171 and the renter pays $29,000. The renter pays $5,171 less, so that $5,171 is also invested. Each year the difference goes into the renter’s investments, which is how the renter’s net worth grows.
The owner’s net worth includes the home’s value at the end, after selling costs. The renter’s net worth includes the invested cash. Neither side is given free money, so the result comes from what each path costs and earns.
Which costs does each side pay?
Owner costs are the monthly loan payment, property tax, maintenance and insurance. The example loan is $320,000 at 6.5% over 30 years, which gives a monthly payment of $2,023. Property tax is 1.1% of value per year and maintenance is 1% of value per year, both calculated on the home’s value as it changes.
Renter costs are rent and renter insurance. The example rent is $2,400 a month, or $28,800 a year, plus $200 of renter insurance, which makes $29,000 in year 1. Rent rises by 3% a year, so the renter pays $50,852 in year 20.
When does buying come out ahead?
In the example, buying comes out ahead from year 6. The first three years favor the renter, with differences of -$30,915, -$25,167 and -$18,709. By year 18 the owner is ahead by $206,517. At the end of year 20 the owner’s net worth is $562,497 and the renter’s is $299,125, a difference of $263,371.
| Year | Owner pays | Renter pays | Owner net worth | Renter net worth | Difference |
|---|---|---|---|---|---|
| 1 | $34,171 | $29,000 | $70,857 | $101,771 | -$30,915 |
| 2 | $34,468 | $29,870 | $86,291 | $111,458 | -$25,167 |
| 3 | $34,774 | $30,766 | $102,330 | $121,040 | -$18,709 |
| 18 | $40,635 | $47,933 | $477,833 | $271,316 | $206,517 |
| 19 | $41,125 | $49,371 | $518,748 | $284,881 | $233,867 |
| 20 | $41,631 | $50,852 | $562,497 | $299,125 | $263,371 |
Years 4 to 17 are left out of the table. To find the break-even year for your inputs, change Years to compare and read the result.
What changes the answer most?
Three inputs move the answer most: Value growth per year, Return on invested cash and Rent growth per year. Higher value growth adds to the owner’s side, while a higher return on invested cash adds to the renter’s side. Rent growth raises the renter’s costs each year. In the example, rent rises from $29,000 to $50,852 by year 20, while the owner’s payments rise from $34,171 to $41,631. Change one input at a time and watch the break-even year and the end difference.
What does the calculator leave out?
The calculator does not include income tax effects, the mortgage interest deduction, moving costs, private mortgage insurance, or HOA fees. The tool gives no market data on home prices, rents or returns, so the example values are only defaults. It is not advice. Check your own figures with a lender, a qualified tax adviser or a local agent before you decide.
Frequently asked questions
Is it better to rent or buy?
The calculator cannot say which is better for you. At the example inputs buying pulls ahead from year 6 and ends $263,371 ahead at year 20, but that depends on the growth and return figures you enter. Test the inputs that matter to you, then check the numbers with a qualified adviser.
How long do you need to stay in a house to break even?
The break-even year is the first year the owner’s net worth passes the renter’s. In the example that is year 6. Change Years to compare and Selling costs to see how the break-even year moves.
Does the calculator include mortgage interest tax relief?
No. The calculator does not include the mortgage interest deduction or other income tax effects. Check those with a qualified tax adviser.
How much cash do you need up front?
In the example you need $92,000: the 20% down payment of $80,000 plus buying costs of 3% of the purchase price. The renter invests this amount in the comparison.
Does the calculator use real home prices or rents?
No. The tool has no market data. Use the rents and value growth you find for your area, and treat the example figures as defaults.
Can renting still be the better choice?
Yes. In the example the renter’s net worth is higher until year 6, leading by $30,915 in year 1 and $18,709 in year 3. Set Years to compare to a shorter period to see how a short stay changes the answer.
What factors should you consider when deciding whether to rent or buy?
The three inputs that move the answer most are value growth, return on invested cash and rent growth. Buying and selling costs and the years you compare also change it. The calculator leaves out income tax effects, the mortgage interest deduction, moving costs, private mortgage insurance and HOA fees, so check those with a lender or tax adviser.
When does buying usually start to look better?
In the example, buying pulls ahead from year 6, when the owner’s net worth catches up with the renter’s. The break-even year moves with value growth, return on invested cash and rent growth, so change one of them at a time and watch the year. Use Years to compare to see whether your planned stay reaches that year.
Related tools
- rental property calculator: use it if you are buying to rent the home out.
- cash on cash return calculator: use it for the return on the down payment.
- rental roi calculator: use it for an investment view of the same house.
- dscr loan calculator: use it if the purchase is a rental.
- short term rental calculator: use it if you could rent part of the home out by the night.
- cap rate calculator: use it to see what the house earns as a rental.