Cap Rate Calculator Canada
Get the cap rate and NOI for a Canadian rental in dollars, with the value at other cap rates.
Free · runs in your browser · nothing is uploaded
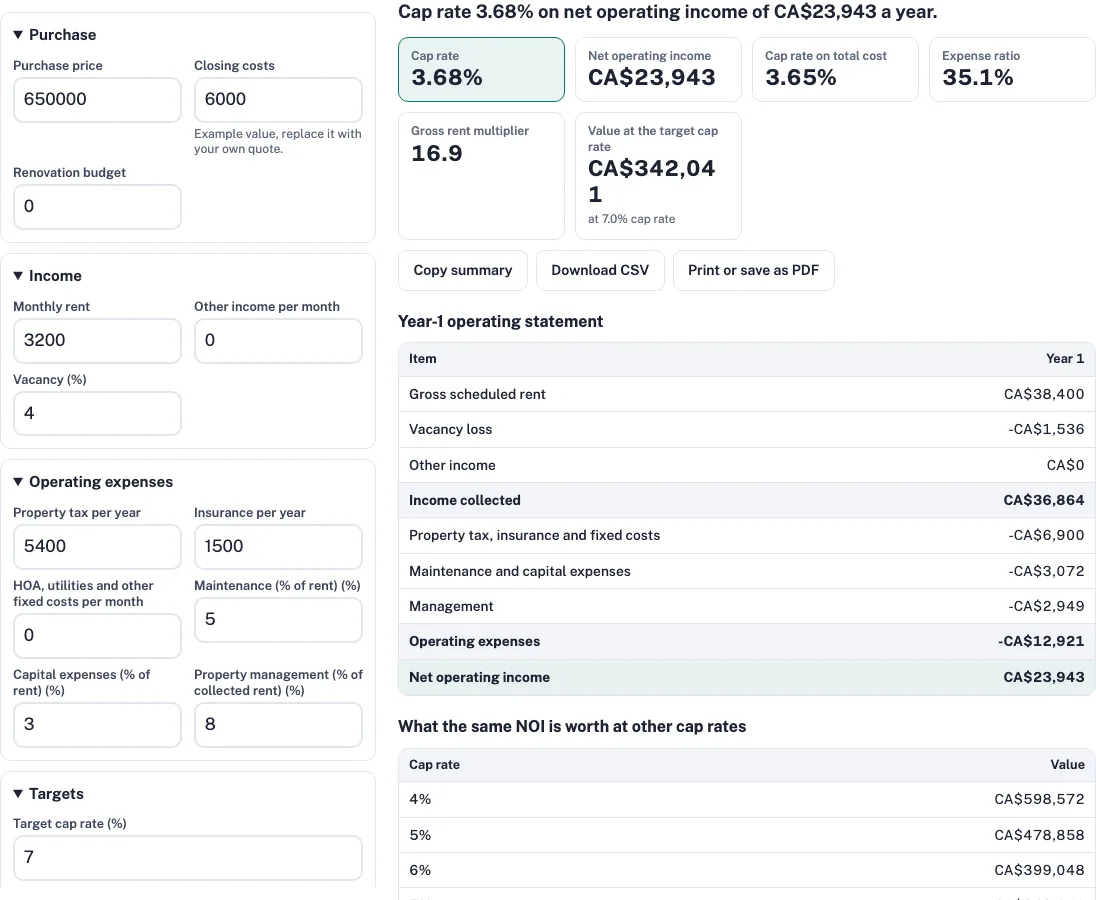
How to use the cap rate calculator Canada
- Enter the Purchase price in CA$ and the Closing costs, including any land transfer tax you expect to pay.
- Enter any Renovation budget you plan to spend before renting.
- Enter the Monthly rent you expect to collect, and any Other income per month.
- Enter the Vacancy as a percentage of gross rent.
- Enter the Property tax per year from your own municipal bill, and the Insurance per year.
- Enter the HOA, utilities and other fixed costs per month, if you pay them.
- Enter Maintenance (% of rent), Capital expenses (% of rent) and Property management (% of collected rent).
- Enter a Target cap rate to see the value the same income would support at that rate.
- Read the Cap rate and Net operating income, then compare the expense ratio.
- Change the rent or price and watch the cap rate grid, which shows how the cap rate moves.
The results update live as you type. Reset to examples restores the sample inputs, Copy summary copies the figures as text, Download CSV saves the results to a file, and Print or save as PDF prints the page. The page address holds your inputs, so a link you share recreates the same result. The example values are defaults for illustration, not market figures.
How is the cap rate worked out in Canadian dollars?
The cap rate is net operating income divided by the purchase price. The calculator uses the same maths as the main cap rate page, framed for a Canadian property. Net operating income is the rent you collect, less the operating costs, and it leaves out the loan. In the example, net operating income of CA$23,943 divided by a price of CA$650,000 gives a cap rate of 3.68%.
Net operating income starts from rent. Gross scheduled rent is CA$3,200 × 12 = CA$38,400. Vacancy of 4% takes off CA$1,536, which leaves income collected of CA$36,864. Operating costs are:
| Item | Year 1 |
|---|---|
| Gross scheduled rent | CA$38,400 |
| Vacancy loss | -CA$1,536 |
| Other income | CA$0 |
| Income collected | CA$36,864 |
| Property tax, insurance and fixed costs | -CA$6,900 |
| Maintenance and capital expenses | -CA$3,072 |
| Management | -CA$2,949 |
| Operating expenses | -CA$12,921 |
| Net operating income | CA$23,943 |
The $6,900 line is CA$5,400 property tax plus CA$1,500 insurance. Maintenance of 5% and capital expenses of 3% are both taken on gross rent: 8% × CA$38,400 = CA$3,072. Management of 8% is taken on collected rent: 8% × CA$36,864 = CA$2,949. Net operating income is CA$36,864 − CA$12,921 = CA$23,943.
The tool also shows two related ratios. The cap rate on total cost divides the same income by the price plus closing costs: CA$23,943 ÷ CA$656,000 = 3.65%. The expense ratio is operating expenses divided by income collected: CA$12,921 ÷ CA$36,864 = 35.1%. Lower expenses raise both ratios, so the cost lines are worth checking one by one.
Cap rate and value at other cap rates in Canadian dollars
The same net operating income supports a different value at each cap rate. A lower cap rate means a higher value for the same income, and a higher cap rate means a lower value. At the target cap rate of 7%, the value is CA$23,943 ÷ 0.07, which is about CA$342,000. The small difference comes from rounding the income figure.
| Cap rate | Value |
|---|---|
| 4% | CA$598,572 |
| 5% | CA$478,858 |
| 6% | CA$399,048 |
| 7% | CA$342,041 |
| 8% | CA$299,286 |
| 9% | CA$266,032 |
| 10% | CA$239,429 |
| 12% | CA$199,524 |
What changes the cap rate?
The grid below shows the cap rate for rent changes down the rows and price changes across the columns. The center cell is the example, at 3.68%. Raising rent by 10% lifts it to 4.16%, while paying 10% more lowers it to 3.35%.
| Rent change (rows) / price change (columns) | Purchase price -10% | Purchase price -5% | Purchase price ±0% | Purchase price +5% | Purchase price +10% |
|---|---|---|---|---|---|
| Monthly rent -20% | 3.04% | 2.88% | 2.73% | 2.60% | 2.49% |
| Monthly rent -10% | 3.57% | 3.38% | 3.21% | 3.06% | 2.92% |
| Monthly rent ±0% | 4.09% | 3.88% | 3.68% | 3.51% | 3.35% |
| Monthly rent +10% | 4.62% | 4.38% | 4.16% | 3.96% | 3.78% |
| Monthly rent +20% | 5.15% | 4.88% | 4.63% | 4.41% | 4.21% |
What is a good cap rate in Canada?
A good cap rate in Canada depends on the city, the property type and the condition of the building. The calculator gives no benchmark figure, and the example is not a market figure. Compare your result with cap rates for similar properties in the same city, and use a local agent or an adviser for that comparison.
What does the calculator leave out?
The calculator works in CA$ and uses the property tax you enter, because property tax is set locally. It does not apply land transfer tax. That tax differs by province and municipality, so add it to closing costs in your own figure. It applies no provincial rent rules. The tool gives no market data, so the example values are only defaults. This is not investment advice.
Frequently asked questions
How do you calculate cap rate in Canada?
Divide net operating income by the purchase price. Net operating income is rent collected, less vacancy, property tax, insurance, maintenance, capital expenses and management, with the loan left out. In the example, CA$23,943 ÷ CA$650,000 gives 3.68%.
What is a good cap rate in Canada?
It depends on the city and the type of property, and the calculator gives no benchmark. Compare your result with similar properties in the same city, and ask a local agent what recent rentals of that type earn.
Does the calculator include land transfer tax?
No. Land transfer tax differs by province and municipality. Add it to closing costs in your own figure before you read the cap rate, because the tool does not know your local rate and cannot add it for you.
Does the calculator apply provincial rent rules?
No. The tool applies no provincial rules. Check the rules that apply to your property with your province and municipality before you rely on the figure.
Can I use the calculator for a property in Ontario?
Yes. Enter the Ontario property tax from your own bill and the local rent you expect. The tool does not apply Ontario rules or use market data.
Does the cap rate include the mortgage?
No. Net operating income leaves out the loan, so mortgage payments are not in the cap rate. The example gives CA$23,943 ÷ CA$650,000 = 3.68% with no loan costs in the sum. The cap rate on total cost, 3.65%, adds closing costs to the price but still leaves out the loan.
What factors change the cap rate?
Rent, vacancy, operating costs and price all move it. The grid on this page shows the effect: a 10% higher monthly rent lifts the example from 3.68% to 4.16%, and a 10% higher price lowers it to 3.35%. Each cost you enter, such as property tax or maintenance, lowers net operating income and the cap rate with it.
How is the cap rate different from cash return?
The cap rate divides net operating income by the price, so it measures the property’s income against its value before any loan. It is not a return on the cash you put in. The cash on cash return calculator on this site uses your cash and cash flow for that.
Related tools
- cap rate calculator: use it for the general version with the US example.
- noi calculator: use it for net operating income, line by line.
- rental property calculator: use it for cash flow and a longer projection.
- gross rent multiplier calculator: use it to see the price as a multiple of rent.
- cash on cash return calculator: use it for the return on the cash you put in.
- DSCR calculator: to see whether the income covers the loan payments.